About the club
Manchester United, nicknamed ‘The Red Devils’, has unarguably been one of the most successful clubs in football history. They have won more trophies than any other club in English football, with a record 20 League titles, 12 FA Cups, 5 League Cups and a record 21 FA Community Shields. United have also won three UEFA Champions Leagues, one UEFA Europa League, one UEFA Cup Winners’ Cup, one UEFA Super Cup, one Intercontinental Cup and one FIFA Club World Cup. In 1998–99, the club became the first in the history of English football to achieve the continental European treble. By winning the UEFA Europa League in 2016–17, they became one of five clubs to have won all three main UEFA club competitions, and the only English club to have won every ongoing top-flight honour available to them.
Sir Alex Ferguson has been the most successful manager for the club. Sir Alex won 38 trophies as manager, including 13 Premier League titles, 5 FA Cups and 2 UEFA Champions Leagues, between 1986 and 2013, when he announced his retirement.
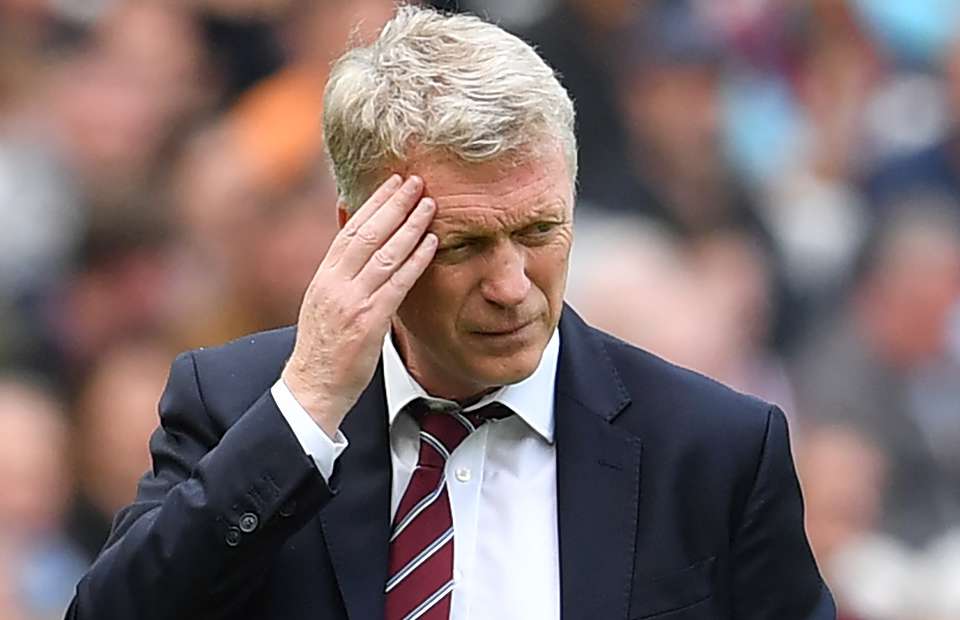
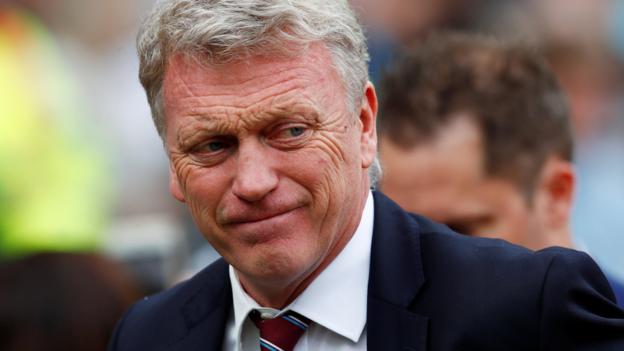
David Moyes then took over in 2013, a time of tumult for the club after SAF decided to step down. Hailed as the perfect successor to Sir Alex, he was sacked after one season, due to lack of performance.
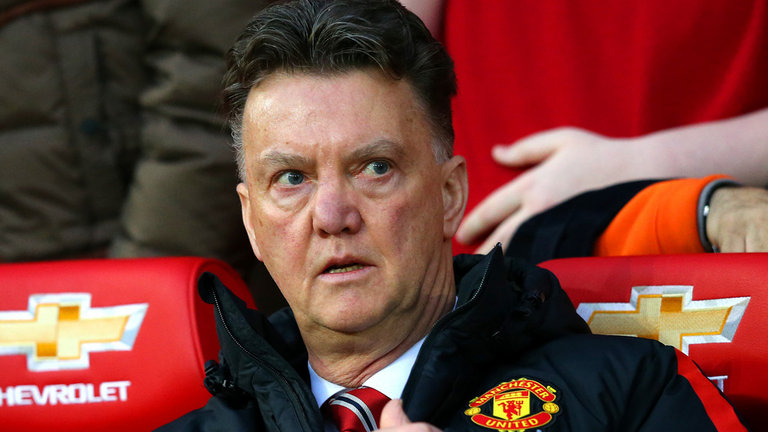
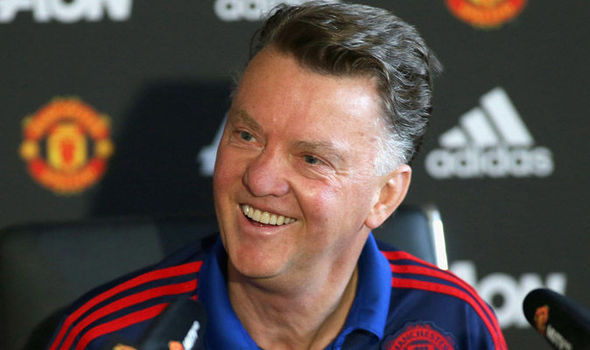
Then came in Louis Van Gaal, the famous coach for an once-all star team of Netherlands and Bayern Munich, in 2014. The tenure of his stay was 2 years and he was sacked in 2016, in the face of huge protests of fans and was accused of destroying Manchester United’s signature style of play.
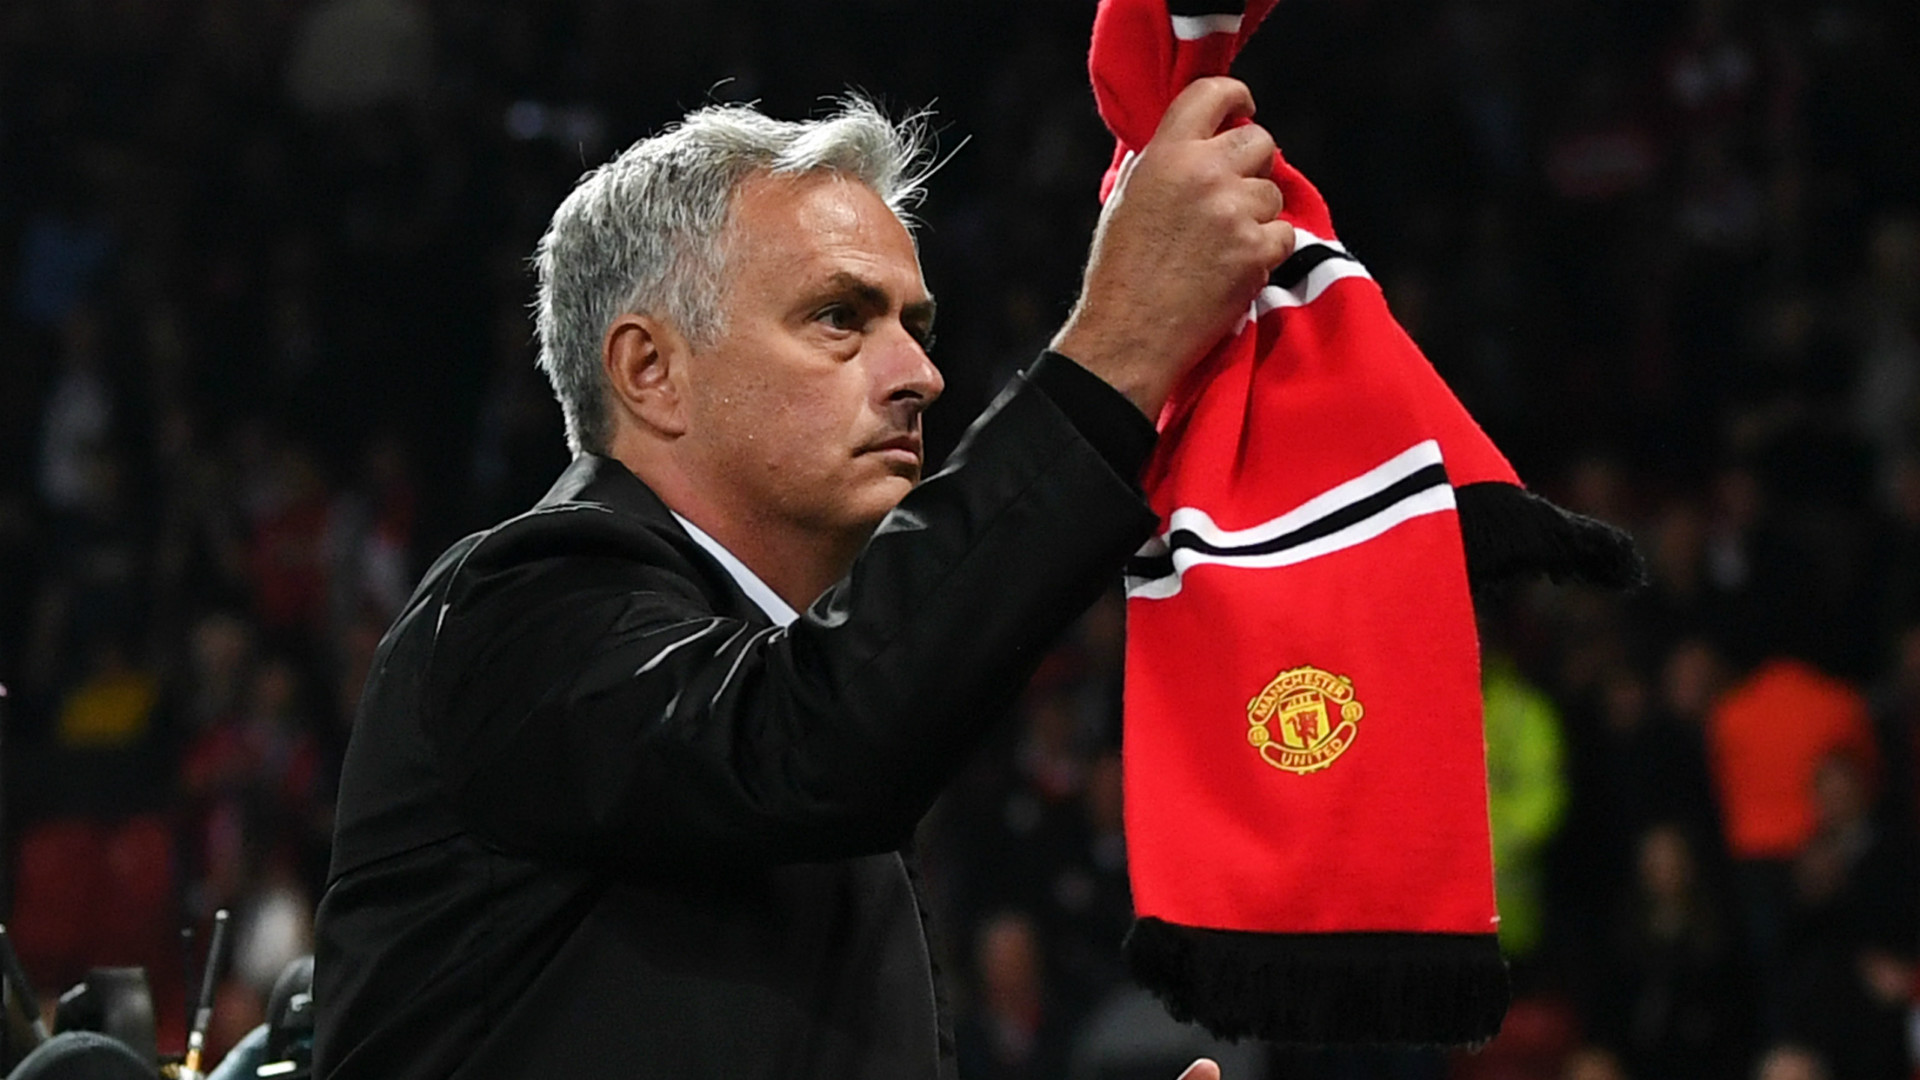
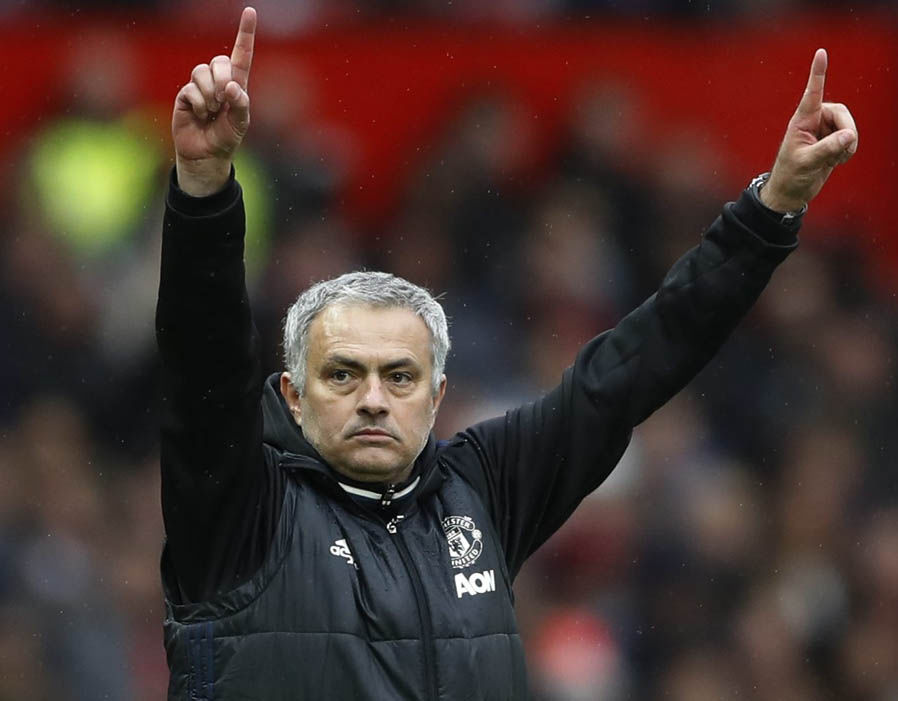
Following this, the club invited more controversy by roping in Jose Mourinho for the job, a man who had won the Champions League with Porto and the Premier League with Chelsea, a ‘man of heavy words’, as many of his critics say.
Were Moyes and Van Gaal really worth their salt? Did Mourinho really bring back the glory days back or can he still now? Did Manchester United find the perfect successor for SAF?
So, how did each of the new managers fare in their newly appointed duties? A duty, which demands great responsibility and Herculean to say the least, the duty to instill fear in the minds of opponents whenever they say their name, the duty to bring back the team to their former glory as the ‘Red Devils’, and to reign in The Theatre of Dreams.
Project Details
- The Kaggle notebook for this project to fork is linked here.
- The Premier League data used here is another Kaggle dataset.
- Python libraries used extensively are :
- pandas - For analysing the data.
- Matplotlib - For plotting the graph.
- More data analyses on the same dataset are :
- Comparing Attack v Defense across different seasons - Coming up.
- How Manchester United did against the other top tier teams - Coming up.
Importing the dataset
import pandas as pd
import numpy as np
data = pd.read_csv('../input/stats.csv')
#The dataset is from Kaggle, linked before.
General Overview of Wins and Losses for Manchester United from seasons 2006-07 to 2017-18
A. Extracting data that is valid only for Manchester United.
data_united = data[data.team=='Manchester United']
#Extracting only data that is valid for Manchester United.
B. Slicing the original DataFrame into two.
One for Wins v Season.
features_wins = ['wins','season']
data_winsVseason = data_united[features_wins] #Extracting out wins for every season.
And another for Losses v Season.
features_loss= ['losses','season']
data_lossVseason = data_united[features_loss] #Extracting out losses for every season.
C. Creating the Matplotlib plot.
import matplotlib.pyplot as plt

#Plotting Wins and Losses v/s Season
plt.rcParams['figure.figsize'] = [12, 8] #creates a graph of 10x7 inches
plt.plot(data_winsVseason.season, data_winsVseason.wins, label = 'Wins', marker='o') #plot Wins v Season
plt.plot(data_lossVseason.season, data_lossVseason.losses, label = 'Losses', marker='o') #plot Loss vs Season, with markers and label
plt.ylim(0,30) #for setting y limits from 15 to 30.
plt.grid(which='major', axis='both', linestyle='-.', linewidth=0.75) #plotting grid. See pyplot.grid in Google.
plt.xticks(rotation=60, fontsize=14) #rotate x axis labels and increase font.
plt.yticks(fontsize=14) #increase yticks fontsize.
plt.legend(fontsize=14) #show labels as legend
plt.title('Wins and Losses v/s Season', fontsize = 20)

try: #try catch is used because here x-coord is a string like 2006-2007 and hence gives a TypeError. So TypeError errors are overlooked in except statement.

    plt.annotate('Moyes comes in', xy=('2013-2014',19), xytext=('2013-2014', 21),arrowprops=dict(facecolor='black', shrink=0.05, width=1, headwidth=8), fontsize =10)
    #For the wins curve. The label is Moyes comes in.
    #xy is the position of marker point. xytext is position of label text.

    plt.annotate('Moyes comes in', xy=('2013-2014',12), xytext=('2013-2014', 14),arrowprops=dict(facecolor='black', shrink=0.05, width=1, headwidth=8), fontsize =10)
    #For losses curve. The label is Moyes comes in.

    plt.annotate('Van Gaal comes in', xy=('2014-2015',20), xytext=('2014-2015', 23),arrowprops=dict(facecolor='black', shrink=0.05, width=1, headwidth=8), fontsize =10)
    #For wins curve when LVG comes in.

    plt.annotate('Van Gaal comes in', xy=('2014-2015',8), xytext=('2014-2015', 11),arrowprops=dict(facecolor='black', shrink=0.05, width=1, headwidth=8), fontsize =10)
    #For losses curve when LVG comes in.

    plt.annotate('Mourinho comes in', xy=('2016-2017',18), xytext=('2016-2017', 20),arrowprops=dict(facecolor='black', shrink=0.05, width=1, headwidth=8), fontsize =10)
    #For wins curve when Mou comes in.

    plt.annotate('Mourinho comes in', xy=('2016-2017',5), xytext=('2016-2017', 8),arrowprops=dict(facecolor='black', shrink=0.05, width=1, headwidth=8), fontsize =10)
    #For losses curve when Mou comes in.

    plt.text('2009-2010',16,'The Famous SAF Era', horizontalalignment='center', verticalalignment='center', fontsize =16, bbox=dict(facecolor='red', alpha=0.5))
    #For the middle big text
except TypeError:
    pass
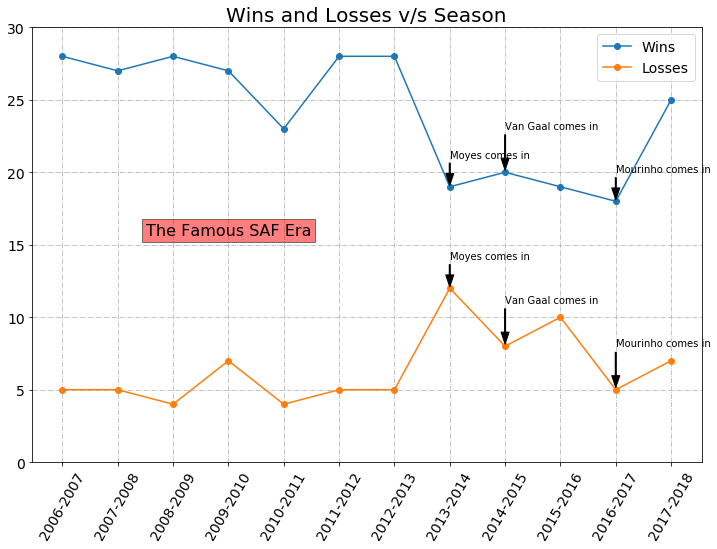
D. Comparing results from the plot.
Comparing the first seasons after coming of new managers
1. David Moyes
-
First Season (2013-14) :
Total number of matches = 38
Total number of wins = 19
Percentage number of wins = 19/38 = 50%
Total number of losses = 12
Percentage number of losses = 12/38 = 31.6%
Decrease in wins than last season = 28 - 19 = 9
Increase in losses than last season = 12 - 5 = 7
2. Louis Van Gaal
-
First Season (2014-15) :
Total number of matches = 38
Total number of wins = 20
Percentage number of wins = 20/38 = 52.6%
Total number of losses = 8
Percentage number of losses = 8/38 = 21%
Increase in wins than last season = 20 - 19 = 1
Decrease in losses than last season = 12 - 8 = 4
3. Jose Mourinho
-
First Season (2016-17) :
Total number of matches = 38
Total number of wins = 18
Percentage number of wins = 18/38 = 47.4%
Total number of losses = 5
Percentage number of losses = 5/38 = 13.2%
Decrease in wins than last season = 19 - 18 = 1
Decrease in losses than last season = 10 - 5 = 5
Final Verdict:
According to the number of wins, i.e., from the win percentage of seasons, Louis Van Gaal had his most successful first season among the three with 52.6% of wins among all matches.
According to the number of losses, i.e., from the loss percentage of seasons, it was Jose Mourinho’s first season which saw the least 13.2% losses from all matches.
Winners:
Loser:
Comparing the second seasons after coming of new managers
1. Louis Van Gaal
-
Second Season (2015-16) :
Total number of matches = 38
Total number of wins = 19
Percentage number of wins = 19/38 = 50.0%
Total number of losses = 10
Percentage number of losses = 10/38 = 26.3%
2. Jose Mourinho
-
Second Season (2017-18) :
Total number of matches = 38
Total number of wins = 25
Percentage number of wins = 25/38 = 65.8%
Total number of losses = 7
Percentage number of losses = 7/38 = 18.4%
Final Verdict
According to the number of wins, i.e., from the win percentage of seasons, Jose Mourinho had a much more successful second season at a 65.8% win percentage - than
- Louis Van Gaal, whose win percentage remained 50%.
- Mourinho’s own first season, in which his win percentage was 47.4%.
Even according to the loss percentage, Jose Mourinho clearly defeats Van Gaal at a 18.4% loss pitted against LVG’s 26.3%, though falls short when his own first season is compared, which had a 13.2% loss among all matches.
Winner:
Losers: